AWS CloudWatch
When you run applications on AWS, you must always know:
Is my server running?
Is CPU high?
Did my app crash?
Are users getting errors?
AWS CloudWatch answers all these questions.
CloudWatch is the monitoring and observability service of AWS.
It helps you see, log, alert, and react to everything happening in your cloud.
What is AWS CloudWatch
CloudWatch is a service that:
Collects data from AWS resources
Stores logs
Tracks performance
Sends alerts
Triggers actions
In simple words:
CloudWatch is the health monitor of your AWS infrastructure.
Why CloudWatch is Important
Imagine you have:
EC2 running a website
RDS database
Load Balancer
If something breaks at 2 AM, CloudWatch can:
Detect the problem
Send you an alert
Or even auto fix it
Without CloudWatch, you are blind.
Main Components of CloudWatch
CloudWatch has five main parts:
Metrics
Logs
Log Groups and Log Streams
Alarms
Dashboards and Events
Let’s understand them one by one.
1. CloudWatch Metrics
Metrics are numbers that show performance.
Examples:
CPU utilization of EC2
Memory usage
Network traffic
Disk read and write
AWS automatically sends basic metrics for:
EC2
RDS
ELB
Lambda
Example:
CPUUtilization = 75%
This means your EC2 is using 75 percent CPU.
You use metrics to:
Monitor performance
Detect overload
Trigger alarms
2. CloudWatch Logs
Logs are text records of what happened.
Examples:
Application errors
Login activity
System messages
Web server logs
Your EC2 does not send logs automatically.
You must install CloudWatch Agent to send logs.
Example logs:
User logged in
Database connection failed
404 error
Logs help you debug problems.
3. Log Groups and Log Streams
CloudWatch logs are organized in two parts.
Log Group
A Log Group is a folder.
Example:
/aws/ec2/app-logs
/aws/lambda/myFunction
Log Stream
A Log Stream is one source of logs inside the group.
Example:
One EC2
One application
One container
So:
Log Group = Folder
Log Stream = File inside the folder
4. CloudWatch Alarms
An alarm watches a metric and takes action.
Example:
If CPU > 80 percent
For 5 minutes
Then send email
You can use alarms to:
Send notifications
Restart EC2
Trigger Auto Scaling
Example:
If CPUUtilization > 80% → Send alert
This keeps your system safe.
5. CloudWatch Dashboard
Dashboard shows all metrics in one place.
You can create graphs for:
CPU
Memory
Requests
Errors
This is useful for:
DevOps teams
Monitoring live systems
You can see the health of your whole app on one screen.
6. CloudWatch Events (EventBridge)
Events allow AWS services to talk to each other.
Example:
EC2 stopped
Lambda failed
S3 file uploaded
CloudWatch Events can trigger:
Lambda
SNS
Auto Scaling
Scripts
Example:
If EC2 stops → Send email
This helps automate reactions.
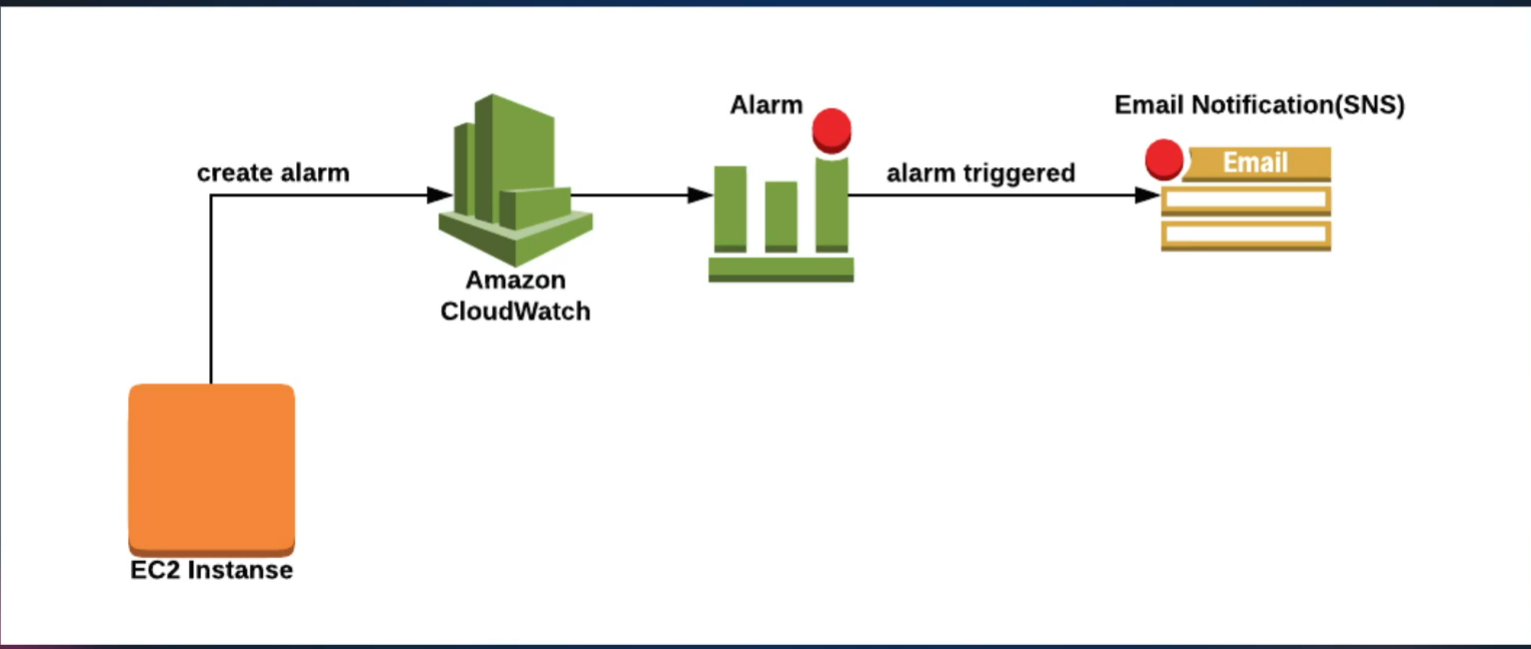
Real Example
You have:
- EC2 running a website
You setup:
CPU metric
Alarm at 80 percent
Notification via email
If traffic increases:
CPU goes high
Alarm triggers
You get alert
Auto Scaling adds new EC2
This is how production systems work.
When to Use CloudWatch
Use CloudWatch when:
You deploy an application
You want to track performance
You want to detect failures
You want automatic alerts
You want to analyze logs
Basically, always use it.
Why CloudWatch is Critical
Without CloudWatch:
You don’t know if your app is down
You don’t know why errors happened
You cannot auto scale
You cannot detect attacks
With CloudWatch:
Full visibility
Real time alerts
Better reliability
Final Thoughts
CloudWatch is the eyes and ears of AWS.
It helps you:
Monitor
Analyze
Alert
Automate
If you want to become a real Cloud or DevOps engineer, you must know CloudWatch.
CloudWatch interview questions
Basic Questions
1. What is AWS CloudWatch?
CloudWatch is a monitoring service that collects metrics, logs, and events from AWS resources to track performance and health.
2. What can you monitor using CloudWatch?
EC2, RDS, ELB, Lambda, DynamoDB, S3, custom applications, and almost any AWS service.
3. What are CloudWatch Metrics?
Metrics are numeric data like CPU usage, memory, disk, network traffic, and request count.
4. What are CloudWatch Logs?
Logs store application and system messages that help in debugging and troubleshooting.
Intermediate Questions
5. What is a Log Group?
A Log Group is a container for related log streams.
6. What is a Log Stream?
A Log Stream is a single source of logs like one EC2 instance or one application.
7. What is a CloudWatch Alarm?
An alarm monitors a metric and triggers an action when a condition is met.
8. What actions can CloudWatch Alarms trigger?
Send SNS notification, start or stop EC2, or trigger Auto Scaling.
9. Does CloudWatch monitor memory by default?
No. Memory and disk must be collected using CloudWatch Agent.
Advanced Questions
10. What is CloudWatch Events?
It is used to react to AWS service changes like EC2 stop, S3 upload, or Lambda failure.
11. How does CloudWatch help in Auto Scaling?
CloudWatch alarms trigger Auto Scaling policies based on CPU or other metrics.
12. What is a custom metric?
A metric you send manually to CloudWatch from your own application.
Real Scenario Questions
13. Your EC2 is slow. How will you use CloudWatch?
Check CPU, network, and disk metrics. Check logs for errors. Create alarms.
14. How will you monitor Apache logs?
Install CloudWatch Agent and send /var/log/httpd/access_log to CloudWatch.
15. How do you get notified if a server goes down?
Create a CloudWatch alarm on instance status check and connect it to SNS.